
Firstly let us briefly understand what GPS means. GPS is a space-based satellite navigation system made up of network of satellites placed by the U.S Dept. of Defence into orbit around Earth. It provides location and time information in all weather conditions, anywhere on or near the Earth where there is an unobstructed line of sight to these GPS satellites. In more simple terms, the GPS receivers compare the transmission and receiving time of the signal from different satellites to calculate the position being mapped, and represent it geographically in terms of latitude and longitude.
 |
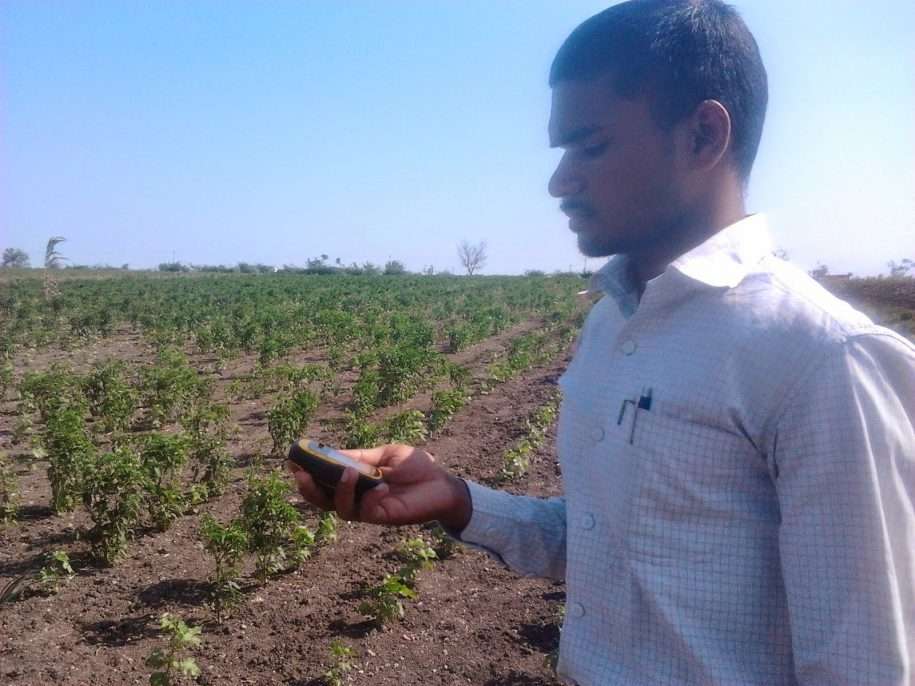
| Enumerator Collecting Perimeter Data |
How to measure the GPS
At IFMR, we have the standard GPS receivers – eTrex-10 devices (picture below), which are extremely efficient and give a good accuracy. This can be as good as 5 meters, even in rural areas where the signal linking on devices is not very strong. Apart from these, other android based hand-held devices like smartphones, tablets etc. can also be used. However, the accuracy in these devices is not as good as the eTrex scientific devices.
Application and Usage
Sampling and Randomization: The GPS coordinates help us with mapping the population/sample and hence can help in better randomization /sample designing. This was extensively used in the Bricks Study: Understanding Competition and Growth in India’s Construction Brick Industry undertaken at IFMR Research. In this study, we used an interesting design of cluster and isolated kilns. For designs where the inter-respondent distance is important, GPS data gives the most accurate calculation for the sampling criteria.
Check the spread of the Control and Treatment units: From the research perspective, it is essential to have a balance in terms of a few parameters such as distance from key entities i.e. market, hospitals, banks etc. For this, an even spread of the Control and Treatment units can be verified using the GPS data.
 |
| Demonstrative Map (Not from Original Design) |
 |
|
Garmin’s eTrex-10 GPS receiver
|
Locating the respondents: This is particularly useful if it is a panel study and data has to be collected over multiple rounds. Revisiting the exact geographical location where the previous rounds of survey was conducted may also help overcome the challenges of local migration (the neighborhood of the original location can redirect to current location), multiple respondents with same name, back checks, tracking the movement etc.
Field Plan: Since the exact spread of the sample can be viewed easily, field plans can be designed in a more efficient and cost effective way.
Devices we use are designed and tested scientifically by the manufacturers. However, by following the simple steps mentioned below, we can have accurate data, which does not require rigorous cleaning.
Some standards to record accurate data need to be followed such as:
- Setting the recording unit of Latitudes and Longitudes as standard for different devices being used in the data collection. They can be set to degrees, decimal or degree minutes seconds.
- Avoiding usage of the devices under electric wires or any electromagnetic range. Any sort of obstruction in the path of the signal may lead to inaccurate calculations by the receiver.
- Checking the battery of the device. Though this is indicated by the device itself, working on a low battery can lead to inefficient signal calculations.
- Checking weather conditions: Sometimes due to clouded sky and rains the transmission of signals is weak and leads to inaccurate data. It is best to avoid recording under such weather conditions. If it cannot be avoided then the accuracy levels of the instruments should be corrected.
- Data entry / recording software can have built in checks and logical bounds which are based on the maximum or minimum possible values in the administrative boundary of the district or block etc.
The GPS data usage can be extended to other research specific objectives. Presentation of the results are also appealing when the impact can be measured in terms of the spread of the intervention, kinds of effects, coverage area etc. When mapped and substantiated with tested data, this can lead to impressive outcomes and consequentially bring about a larger impact.