

Skill development has emerged as a key policy priority for India. In this article, Pratibha Joshi examines existing options for understanding skill components of training courses, their shortcomings, and proposes some alternatives.
While there has been a massive push for skilling and increased allocation of resources towards it, there is need for a better understanding of how skilling programs generate impact. In this article, Pratibha Joshi examines existing options for understanding skill components of training courses, their shortcomings, and proposes some alternatives.
The Government of India has sharpened its focus on ensuring today’s youth acquire necessary skills to participate in the labour force. As of June 2017, skills training programs under the Ministry of Skill Development and Entrepreneurship (MSDE) have trained 1.17 crore candidates under the Skill India initiative (MSDE). However, beyond skilling, candidates also face a challenge in finding jobs where they can put their newly acquired skills to use. Since 2016, Pradhan Mantri Kaushal Vikas Yojana (PMKVY2) had placed a little over 12% (95,772 candidates) of the 7.84 lakh trained candidates as of October 2017 (PMKVY).
The government has undertaken big push efforts to build technical capabilities and work capacities in the burgeoning workforce. But are we able to gauge and differentiate between the skills our workforce is acquiring? Are we able to map skills acquired to the skill requirement of occupations?There is a need to ensure that we create a method for categorizing the skill components of jobs and training courses. This would be useful for policy makers in identifying sectors and skills that require more attention and resources, and also help gauge the level of human capital development that we are achieving through initiatives such as Skill India.
What are some ways to quantify the skills our people are acquiring?
The MSDE’s National Skills Qualification Framework (NSQF) offers a practical framework that lists various levels of skills qualifications. The competency-based framework organises all qualifications according to a series of levels of knowledge, skills and aptitude. This is akin to the standards of the education system where students can acquire greater capabilities through every additional year of schooling (e.g. completing class 8, class 9, etc). NSQF levels allow for ranking of skilling courses from levels 1 to 10. As 80% of the skills training courses are for NSQF levels 3 – 5 (see Table 1), it is expected that a large number of candidates would end up being trained at these same levels. Furthermore there is no granular classification of the NSQF that can be analysed to know if there are any differences in the skills and knowledge that trainees participating in different courses can acquire.
Table 1
|
NSQF
level |
No.
of Qualification Packs (QP) |
|
1
|
14
|
|
2
|
104
|
|
3
|
332
|
|
4
|
892
|
|
5
|
336
|
|
6
|
151
|
|
7
|
108
|
|
8
|
11
|
|
9
|
1
|
|
Total
|
1949
|
Data source: NSDC excel file as of 8th June 2017
A second metric for measuring skills acquired by trainees, could be the number of National Occupational Standards (NOS), which tells us the number of tasks a person should have learnt within a certain training course. Every training course comprises of a Qualification Pack (QP) which contains the number of NOS that the candidate should be taught and acquire abilities on.
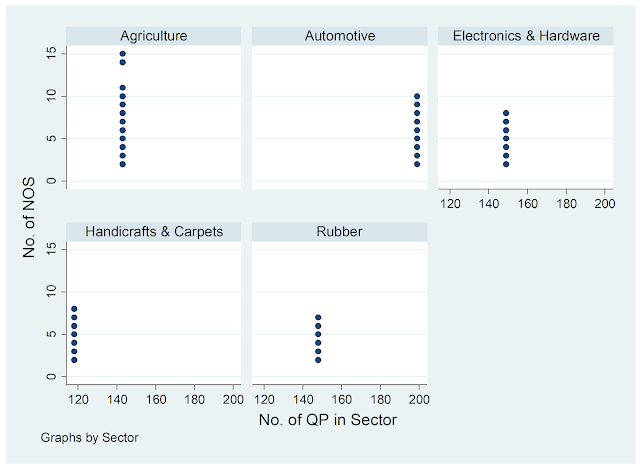
Chart 1 and Chart 2 demonstrate that most courses end up with an average of 10-15 NOS per QP. It is likely that some of these tasks are different in terms of the capacities they focus on; some could require greater soft skills, or more technical skill – but right now, we cannot know the skill component that candidates acquire, beyond number of NOS, as the different skill components have not been classified and linked to the different NOS.
Chart 1: Examining number of NOS across QPs (for the different NSQF levels)
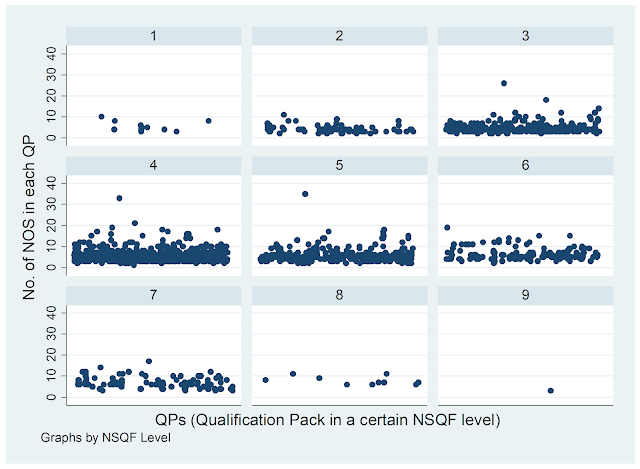
Data source: NSDC excel file as of 8th June 2017
Chart 2: Number of NOS for QPs in a Sector
These are the top five sectors with the maximum number of QPs designed
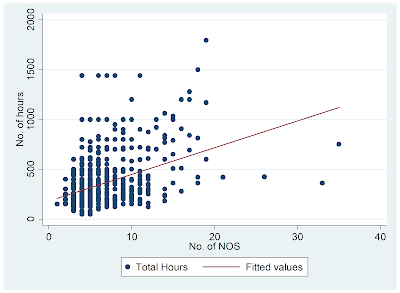
Finally, the number of hours spent in training can also be used as a proxy to benchmark skills obtained by trainees. Keeping aside concerns with using hours as a proxy for skills learnt, and exploring the possibility of using this as a measure – we find that the number of hours that have been assigned to the various courses do not show a clear upward trend (see Chart 3). This means that for increasing numbers of NOS, additional hours that intuitively maybe required for acquiring such capabilities do not seem to be the case. Hence correlation between hours spent on a QP (to acquire the mandated NOS) is broken.
Chart 3: Number of Hours assigned to Number of tasks to be Learnt through a course
To sum up, metrics presently available are not adequate to provide quantitative information on the skill component of jobs and training courses in India. This leaves us without a clear understanding of the level of skills acquired by candidates, and has implications for planning and implementing programs that boost human capital in India.
A preliminary review of literature on the subject presents some interesting alternatives. For instance, Balasubramanian (2016) estimates skill component of occupations by mapping jobs in India to the Occupational Information Network (O*NET) framework created and used by USA for classifying knowledge, skills and abilities required for a job. Apart figuring ways to develop a framework similar to O*NET for India, we can also consider creating a task-framework a la Autor, Levy, Murnane (2003) to classify core task requirements such as: cognitive, non-cognitive, repetitive, non-repetitive components of various skilling courses. These task requirements can be derived from curriculum available for every QP. This exercise can provide estimates of the relative use of different cognitive and physical skills in different tasks. It will also facilitate identifying jobs and sectors that face faster technological changes that affect labour markets. Autor and Acemoglu (2011) build on the task-framework for classifying jobs and mapping them to skills to estimate the effects of automation and by understanding the skill component of jobs and assuming that repetitive or non-cognitive aspects could be automated first, thereby providing information on what jobs and sectors might require government intervention for easing some labour market frictions caused by technological changes.
Better data and classifications for analysis can help unearth important gaps in our efforts to upskill the Indian labour force. For instance, Chart 1 showed that on average our training courses cover 10-15 tasks, which pales in comparison to global averages of 30 tasks per course, thus raising questions on how Skill India can train workforce that can meet global labour requirements.
As considerable public resources are being spent on skilling programs in India, it is important to build a deeper understanding of their linkages with labour markets, and the expected interplay with technological changes in different sectors. Having a well-classified framework of the different skill components of courses and their equivalent jobs, can significantly augment our present understanding of the potential of skills training courses, human capital development, and explore the possibilities of automation across sectors and functions.
Pratibha is a Research Fellow at IFMR LEAD and wants to play a meaningful role in the development of the SME sector.
This article originally appeared in the IFMR News Digest, February 2018.